Philadelphia
Philadelphia’s infrastructure quality is mixed, with significant investments in green stormwater systems and ongoing upgrades, but persistent challenges remain due to aging assets and urbanization.
1.51.5 M+
Population
370370 km²
Area
4,4934,493 /km²
Density
Growth Trends
10.5K
The projected net population growth in Philadelphia for 2024 is 10,500 residents.
Working-Age Population
54%
58% of the European Union population was of working age (20–64 years) in 2023.
Employment Rates
Key industries include healthcare, life sciences, financial services, and technology, with major corporations like Comcast, AmerisourceBergen, and Aramark playing significant roles.
Educational Attainment
Tertiary attainment among young adults aged 25-34 in OECD countries increased from 45% in 2019 to 48% in 2024, placing it among the top OECD nations.
Foreign Residents
The average income for foreign residents in Philadelphia is about 1.01 million yen, with roughly 22% earning less.
Ethnic Composition
Foreign residents in Philadelphia surpassed 247,000 in 2024, making up about 15.7% of the city population, with largest groups from China, Dominican Republic, India, Vietnam, Jamaica, Mexico, Haiti, Ukraine, Brazil, and Cambodia.
Commuting
In June 2025, Philadelphia’s regional rail averaged 80,214 weekday trips, with over 700,000 total daily transit rides connecting suburbs and central city for work.
Migration Patterns
Philadelphia continues to attract residents from other regions with a net inflow of 6,000 people in 2024.
Average Income
71K
The average annual income in Philadelphia is about 10.7 million yen, though more than half earn less than this amount.
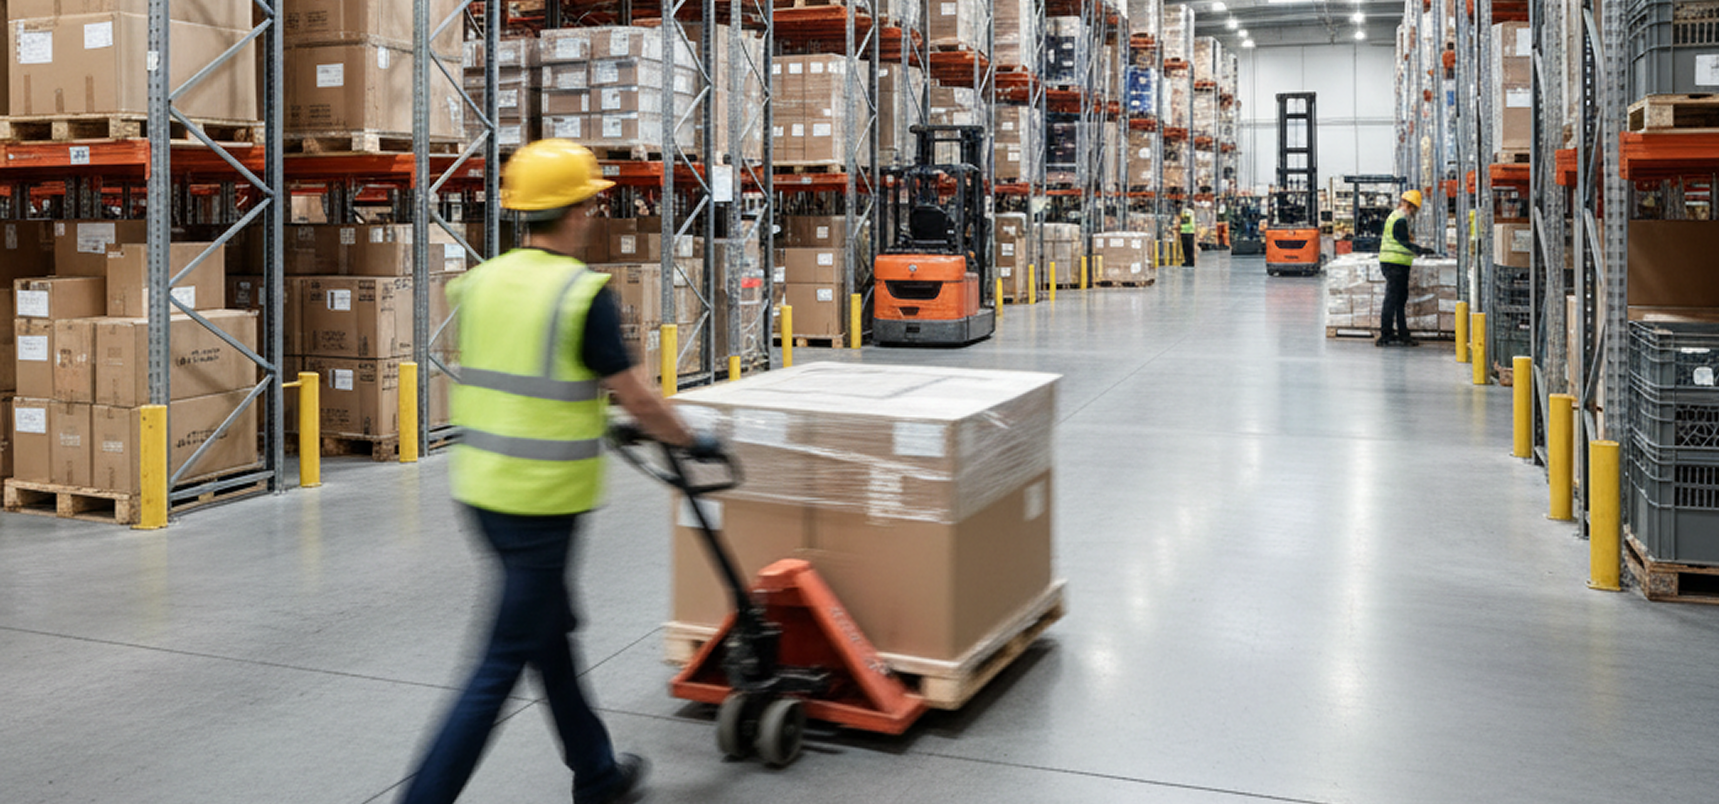
Transportation & Logistics Overview
Warehousing & Fulfillment Landscape
Space and Vacancy Rates
8.6%
Lease Rates and Warehouse Classes
Warehouse lease rates in Philadelphia typically range from $5 to $15 per square foot per year, with Class A modern facilities at $10–15, standard spaces at $7–12, and older buildings at $5–8.
Major Warehouse Districts
Northeast Philadelphia, South Philadelphia/Navy Yard, Philaport Distribution Center, Roosevelt Boulevard, Southeastern PA Corridor, New Jersey Waterfront, and areas near Philadelphia International Airport.
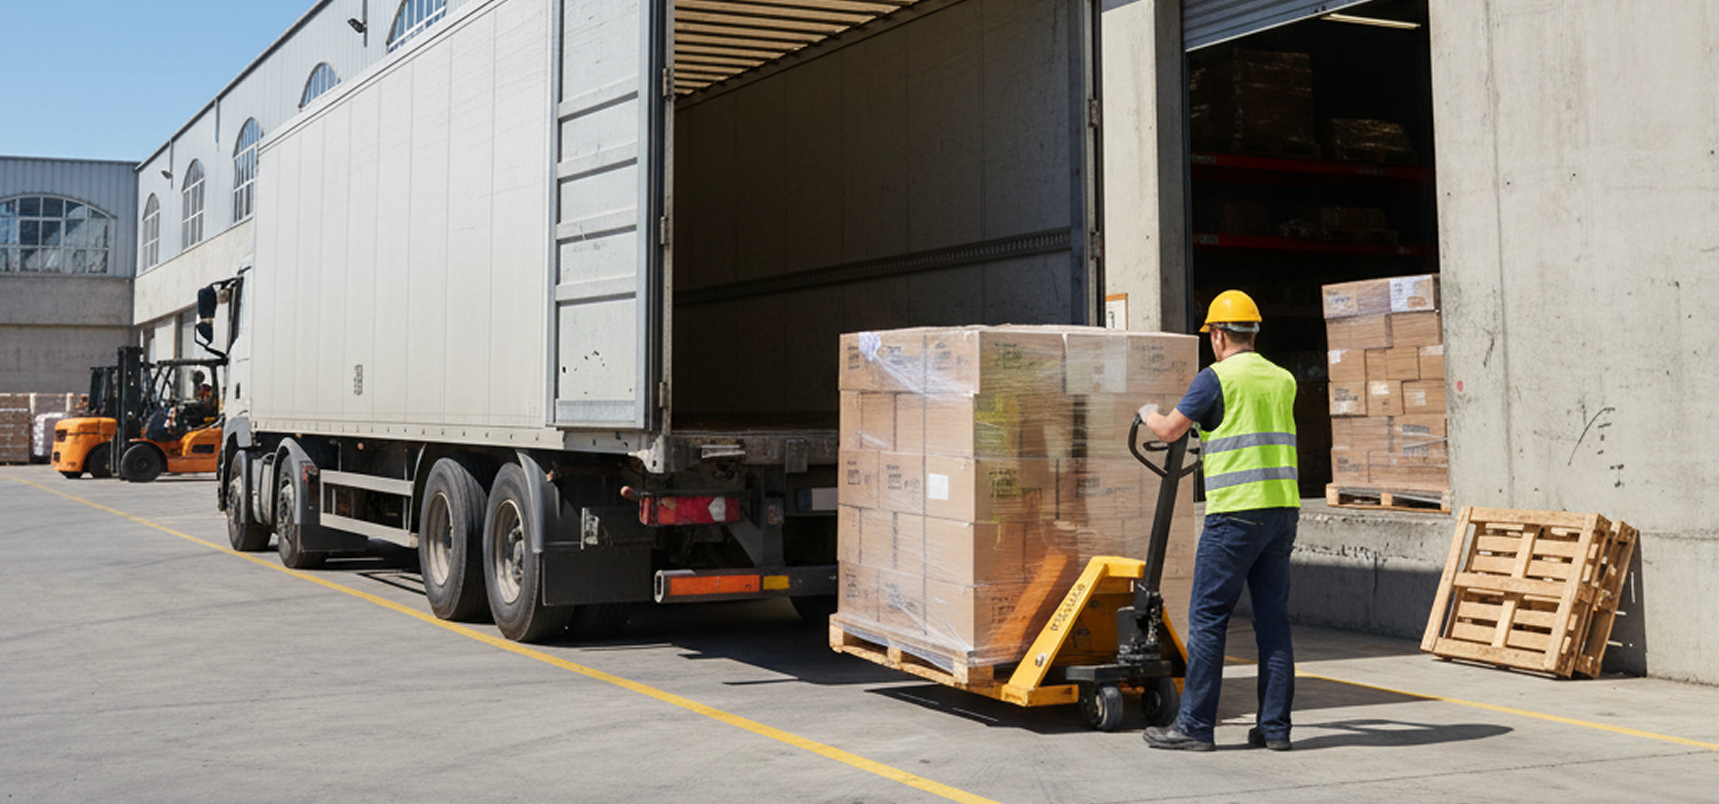
Last-Mile Delivery Infrastructure
Philadelphia serves as a strategic last-mile delivery hub with major facilities like UPS's new 1-million-square-foot automated distribution center and extensive same-day delivery networks serving the Northeast corridor's 6.1 million metropolitan population.
Automation and Technology Adoption
Philadelphia warehouses are rapidly adopting automation technologies such as robotics, AI-driven software, and micro-fulfillment centers to boost efficiency, accuracy, and scalability in response to e-commerce growth and labor shortages.
Cold Storage and Specialty Warehousing
Cold storage and specialty warehousing facilities in Philadelphia offer temperature-controlled storage, refrigerated and frozen goods handling, dry storage, blast freezing, cross-docking, and logistics services for food and perishable products.
Supply Chain Analysis
Key Industries
Key industries and economic sectors in Philadelphia include healthcare, higher education, financial services, life sciences, manufacturing, technology, tourism, oil refining, food processing, telecommunications, and logistics.
Major Logistics Providers
Penske Logistics, 721 Logistics, William Parker Associates, Beltok Cargo, APB Transportation, South Street Business Center, Equip Trucking & Warehousing, Galasso Trucking, Cr1 Xchange, Evans Network of Companies, Jillamy, DrayNow, Locus Mobility, Chain.io, FIRST, nextmv, Logicstics, Sharing Excess, Berry Tag, Omni Logistics, Delta Air Lines, Amazon DSP, Airspace, Capstone Logistics, J.B. Hunt, Amtrak, Uber Drivers, R+L.
Import/Export Volumes and Trading Partners
Philadelphia’s port handled 841,000 shipping container units in 2024, with major imports including fruits, vegetables, meat, and textiles primarily from Chile, Costa Rica, Guatemala, Colombia, and Vietnam, while key exports like meat are shipped mainly to Puerto Rico and Australia.
Supply Chain Resilience
Philadelphia’s supply chain resilience is challenged by reliance on global networks, limited domestic redundancy, and vulnerability to disruptions in critical sectors, with risk factors including supplier concentration, logistical bottlenecks, and insufficient visibility across the chain.
Local Manufacturing Capabilities
Philadelphia has a resilient and diverse manufacturing sector with strengths in pharmaceuticals, biotechnology, chemicals, aerospace, food processing, and advanced electronics, supported by recent growth and innovation trends.
Industry Clusters
The main industry clusters in Philadelphia are health care, education, business services, hospitality and leisure, life sciences, financial services, technology, and manufacturing.
Competitive Advantages
Philadelphia’s key competitive advantages as a logistics/business hub include its prime East Coast location, multimodal transportation infrastructure, proximity to major consumer markets, advanced port facilities, competitive real estate costs, skilled workforce, and business-friendly environment.
Infrastructure Assessment
Detailed evaluation of Philadelphia's infrastructure quality, investment projects, utility systems, and environmental considerations for strategic planning.
Quality and Capacity
Philadelphia’s infrastructure is undergoing significant upgrades with historic federal investment, but faces ongoing challenges in safety, accessibility, and capacity, especially on key corridors and intersections.
Planned Investments
Philadelphia is planning over $78 billion in multimodal transportation and infrastructure investments by 2050, including upgrades to roads, public transit, water systems, airports, bridges, and green spaces, supported by federal, state, and local funding.
Utilities Reliability and Costs
Philadelphia's utility infrastructure includes PECO for electricity distribution with deregulated supplier choice, Philadelphia Water Department serving 1.7 million drinking water customers, Philadelphia Gas Works as the nation's largest municipal gas utility, and multiple internet providers led by Verizon Fios and Xfinity offering fiber and cable services.
Environmental Factors
Environmental factors affecting logistics in Philadelphia include pollution from industrial activities, increased vehicular emissions from logistics centers, and significant air emissions from port operations.